Popular items
Value Range: $22.95 - $43,200.00
Value Range: $36.45 - $96,000.00
Value Range: $101.00 - $42,000.00
Value Range: $7.63 - $10,600.00
Value Range: $36.45 - $96,000.00
Value Range: $36.45 - $6,500.00
Value Range: $105.00 - $162,000.00
Value Range: $36.45 - $17,300.00
Value Range: $36.45 - $31,200.00
Value Range: $36.45 - $50,400.00
Value Range: $36.45 - $16,200.00
Value Range: $520.00 - $1,380,000.00
Value Range: $108.00 - $102,000.00
Value Range: $36.45 - $21,600.00
Value Range: $108.00 - $74,400.00
Greysheet Catalog (GSID) Stats
Catalogs:
4Items:
271,976Values:
1,039,627Auction Records:
3,180,622Images:
7,638,643Greysheet News
View all news


Visit these great CDN Sponsors
CDN Sponsors


Our Publications
View subscription plans
Since 1963, the Greysheet has been a critical tool for numismatic professionals. Every serious dealer, investor & collector of U.S. coins keeps their copy at close hand!
A necessity for dealers, investors & serious collectors of U.S. bank notes.
A necessity for dealers, investors & serious collectors of U.S. bank notes.
Over 100 pages of coin pricing! Just $15 per issue with a subscription.
The premier pricing guide for collectors, investors & dealers of CAC-approved certified U.S. coins.
Comprising 322 individual country chapters (and growing!), with over 9,500 pages covering more than 97,000 types and varieties, the Banknote Book is the most comprehensive catalog of world paper money in existence.
Loaded with essential information for collectors, dealers, and investors.
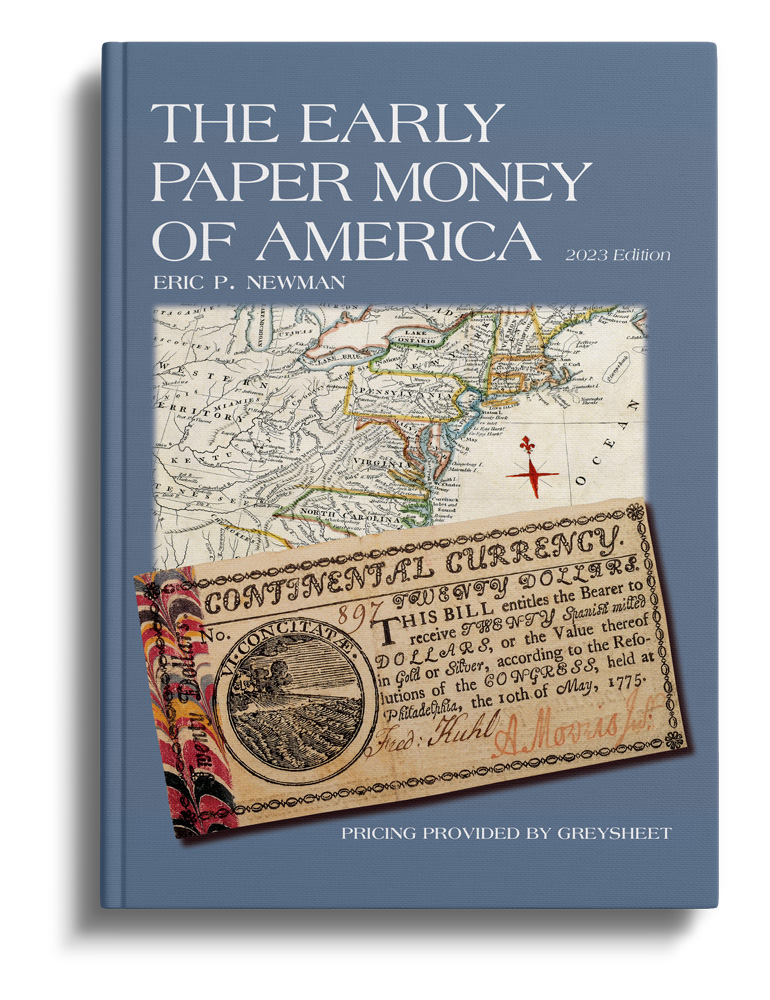
The 2023 Edition fills 472 pages of this rare and indispensable guide to colonial paper money includes all-new pricing by the CDN editors of Greensheet, and now includes hundreds of color images.
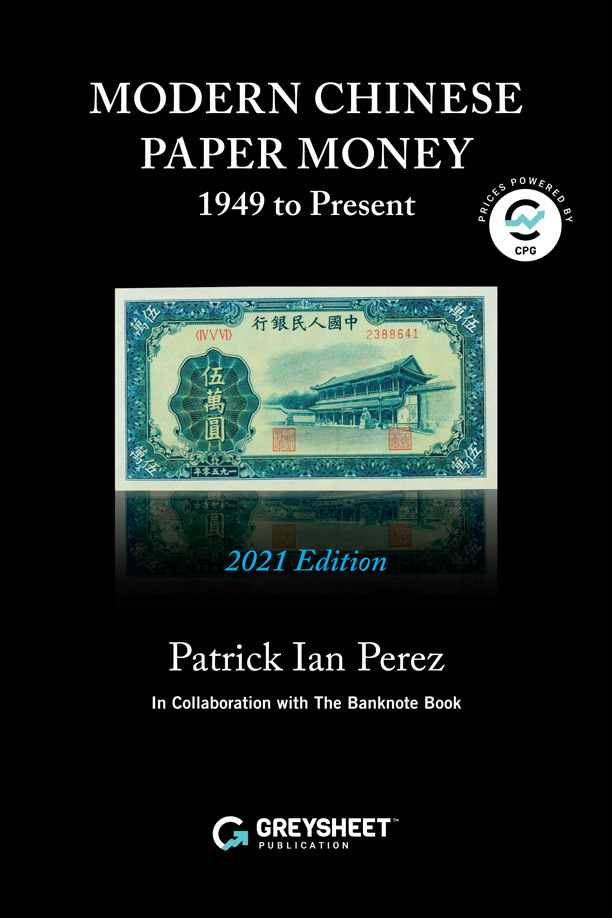
This critical book is the only English-language reference of its kind on this popular collectible.
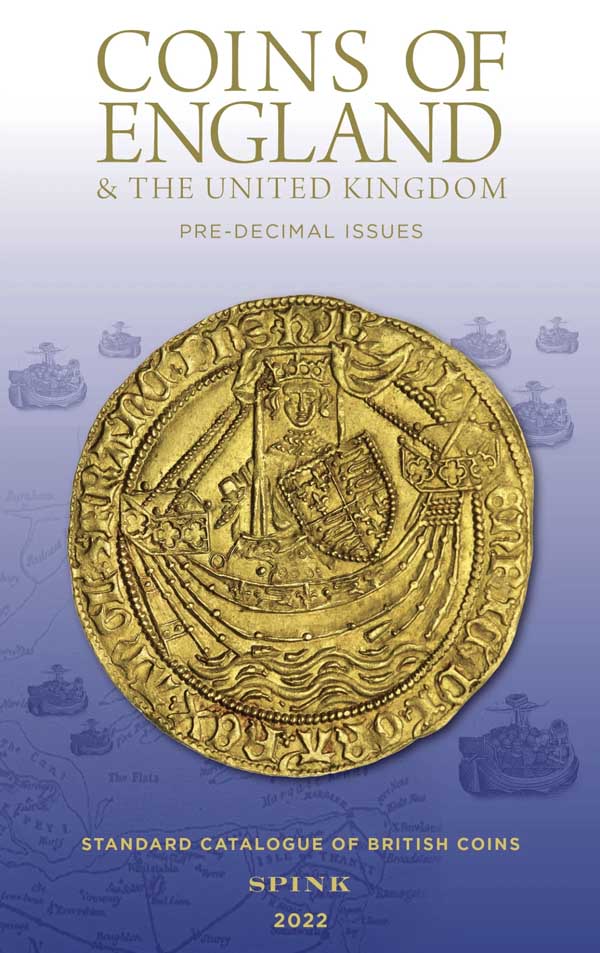
The 57th Edition (published 2022) of the industry-standard reference book for British coins is still the only catalogue to feature every major coin type from Celtic to the Decimal coinage of Queen Elizabeth II, arranged in chronological order and divided into metals under each reign.
New research, new photographs, updated pricing, the latest U.S. Mint data, new auction records, and more!
- 472 pages
- 7,200 Listings pages
- 32,500 Coin prices
- Full color
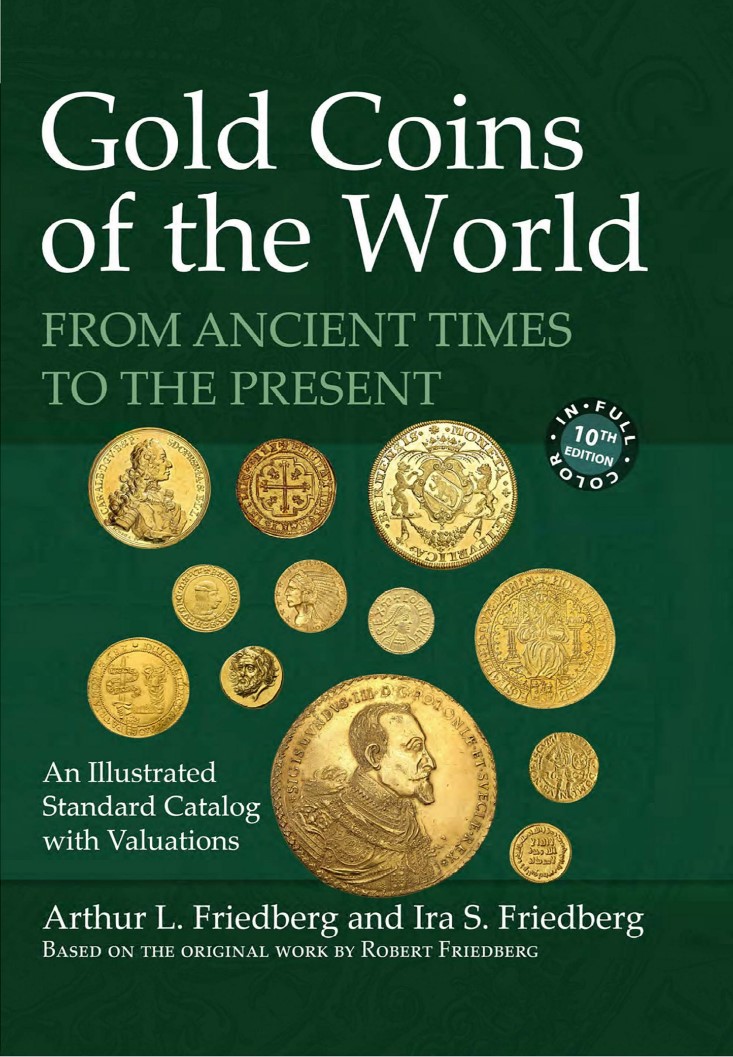
New. Revised. Expanded. Now with photos in full color. For the numismatist, banker, economist, historian, or institution of higher learning, the tenth edition is a book for every library, public and private.
15 Years in the Making! New research, new photographs, updated pricing, the latest U.S. Mint data, new auction records, and more...
Events Calendar
View all events